remote_serial_monitor
Table of Contents
Remote Serial Monitor
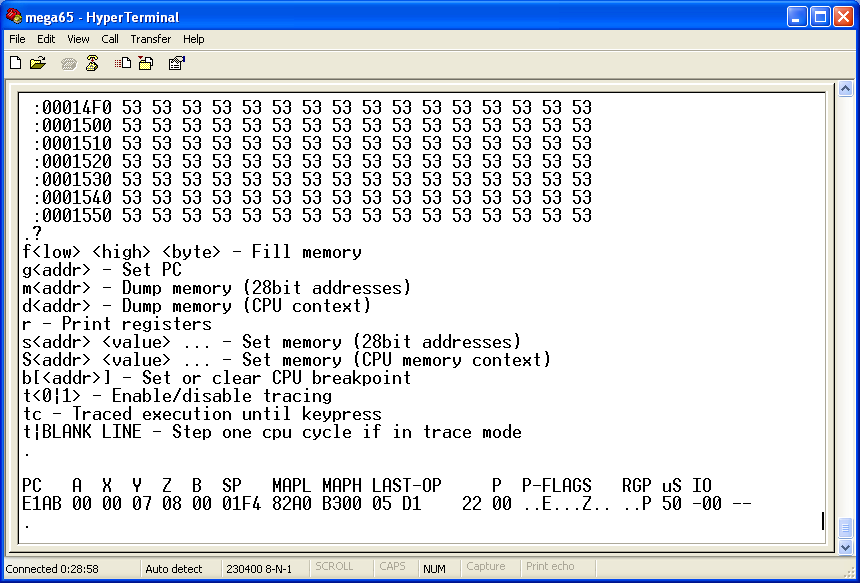
The Remote Serial Monitor is a handy tool to help you debug the MEGA65 System.
Documentation exists for it in the following locations:
-
- See the “4.3 Remote Serial Monitor (handy for debugging)” section
-
- Some extra usage info exists in this page of Ben's fork of the github repo
- Typing “?” within the monitor (via your terminal app) to see a list of slightly outdated commands
m65dbg
I'm currently developing a comms tool to enhance debugging support for the mega65.
It's still early days, but some present perks are:
- It preserves the history of past commands typed (via the readline library, eg, you can use CTRL-R to do a reverse search through past commands)
- Pressing 'ENTER' key will repeat the last command (handy when using the 'M' command to dump out consecutive chunks of memory)
- Can disassemble the code at the current pc as you step through
- If you run the app in the path containing the *.list files for your project (and your *.list files were generated via a newly-tweaked version of Ophis that provided more verbose output in .list files), then you will also see the .a65 source-code line as you step through
- If you run the app in the path containing the *.map files for your project, you can use symbol-names in-place of raw addresses for many of the m65dbg commands.
The source for the m65dbg app is available here:
Building
- You will need to install a few pre-requisite libraries (via apt-get/yum/zypper, or cygwin's setup.exe)
- libreadline-devel
- git clone https://github.com/MEGA65/m65dbg
- cd m65dbg
- make
- This will produce the “m65dbg” executable (or, “m65dbg.exe”, in Cygwin's case)
Walkthrough
For a youtube video walkthrough, please visit:
Here's some written points below:
- Presently, I'm building it for windows-cygwin, but I'm hopeful with a bit of tweaking of the Makefile and source (particularly relating to libreadline), it'll build fine in macosx and linux.
- Presently, inside the “main.c” file, I've hard-coded the serial-port to point to “/dev/ttyS4”, as that's what it appears like on my system. This probably isn't ideal, as everyone's serial-port device names will be different. So for now, please just replace that line with the device-name on your system :)
- Try the following steps:
- ./m65dbg
- r (to print out current registers)
- b<addr> = a raw command to set a hardware breakpoint
- t1 (to turn trace mode on, a bit like ctrl-c breaking inside gdb)
- t0 (to turn trace mode off, a bit like doing 'c'/continue in gdb)
- n (my 'next'/step-over command, which uses the hardware's step-into command multiple times, can be very slow)
- s (my 'step-into' command, which just calls the hardware's step-into)
- [ENTER] key will repeat the last command
- finish (my 'step-out-of' command, which calls 'n'/next multiple times, can be very slow, depending on how busy the current function is)
- pb/pw/pd/ps <addr> = prints byte/word/dword/string values at the given address
- typing “help” will give you the list of m65dbg commands, while typing “?” will give you the list of raw commands.
remote_serial_monitor.txt · Last modified: 2016/08/14 01:19 by gurce